2024
Insinga, L. (Applied Analysis Solutions, LLC); Kay, S. (Pyxis Regulatory Consulting, Inc)
Refinements to Use Data Layers (UDLs) Used in Endangered Species Assessments of Pesticides Presentation
10.20.2024.
Abstract | Links | Tags: 2024, Presentation, SETAC North America
@misc{2024NA-CSB,

title = {Refinements to Use Data Layers (UDLs) Used in Endangered Species Assessments of Pesticides},

author = {Insinga, L. (Applied Analysis Solutions, LLC) and Kay, S. (Pyxis Regulatory Consulting, Inc)},

url = {https://appliedanalysis.solutions/wp-content/uploads/2024/10/SETAC-NA-2024-CSB-Based-UDLs.pdf, View Presentation},

year  = {2024},

date = {2024-10-20},

urldate = {2024-10-20},

abstract = {In their Endangered Species (ES) assessments for pesticides, the US Environmental Protection Agency (EPA), US Fish and Wildlife Service (FWS) and National Marine Fisheries Service (NMFS) use datasets called Use Data Layers (UDLs) to spatially delineate potential pesticide use sites. For agricultural uses, the UDLs are currently generated from the US Department of Agriculture’s (USDA) Cropland Data Layer (CDL) raster dataset, which is created using a machine learning classification algorithm applied to satellite imagery, agricultural ground truth data, and other ancillary datasets. The current approach for generating agricultural UDLs sources 5 years of CDL datasets which are processed by grouping the more than 100 individual CDL cultivated classes into 13 general UDL classes. While this approach is robust, there are some challenges. One challenge with generating agricultural UDLs is the presence of “spurious pixels” or highly fragmented areas of the UDL that are known to be false-positive classifications (i.e., non-agricultural raster cells classified as agriculture) carried through from the source CDL dataset. The presence of spurious pixels can result in inaccurate estimations of co-occurrence between UDLs and listed species locations, and it is desirable to remove spurious pixels to the greatest extent possible. However, it is difficult to identify and filter spurious pixels in a programmatic way given the nature of the remotely sensed source dataset. Furthermore, it is undesirable to remove actual agriculture from the UDLs, which can occur if agricultural pixels are misidentified as spurious. To address this issue, we propose to mitigate the presence of spurious pixels by incorporating additional processing steps to generate more accurate UDLs. This method builds on the USDA’s refinement of the base raster CDL data into a vector Crop Sequence Boundary (CSB) dataset that uses publicly available data and employs a transparent yet efficient processing workflow. This new methodology virtually eliminates spurious pixels from the UDLs and provides the added benefit of significantly improved processing efficiency leading to a reduction in processing time from weeks for the original CDL based approach to overnight using the new CSB based approach.},

keywords = {2024, Presentation, SETAC North America},

pubstate = {published},

tppubtype = {presentation}

}
Christian, D. (Applied Analysis Solutions, LLC); Kern, M. (Balance EcoSolutions, LLC); Holmes, C.M. (Applied Analysis Solutions, LLC); Kay, S. (Pyxis Regulatory Consulting, Inc); Cowles, J. (Tessenderlo Kerley, Inc.); Henry, K. (Tessenderlo Kerley, Inc.)
10.20.2024.
Abstract | Links | Tags: 2024, Presentation, SETAC North America
@misc{2024NA-PULAs,
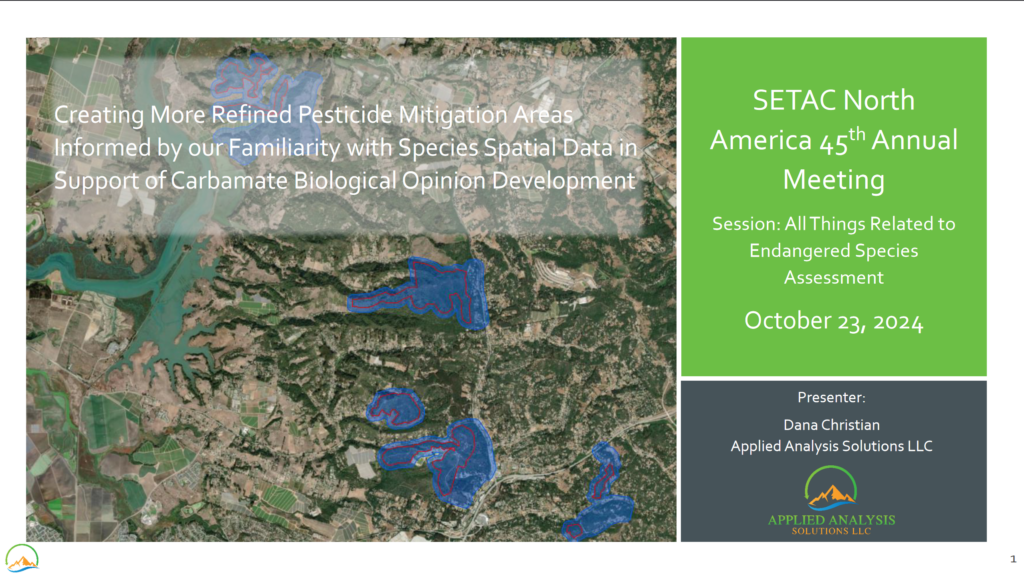
title = {Creating More Refined Pesticide Mitigation Areas Informed by Our Familiarity With Species Spatial Data in Support of Carbamate Biological Opinion Development},
author = {Christian, D. (Applied Analysis Solutions, LLC) and Kern, M. (Balance EcoSolutions, LLC) and Holmes, C.M. (Applied Analysis Solutions, LLC) and Kay, S. (Pyxis Regulatory Consulting, Inc) and Cowles, J. (Tessenderlo Kerley, Inc.) and Henry, K. (Tessenderlo Kerley, Inc.)},
url = {https://appliedanalysis.solutions/wp-content/uploads/2024/10/SETAC-NA-2024-PULAs-Carbamate-BO.pdf, View Presentation},
year = {2024},
date = {2024-10-20},
abstract = {Pesticide mitigation areas are designed to ensure a pesticide’s use will be protective of listed endangered or threatened species and their critical habitat. A species range can be geographically broad and can include areas unsuitable for habitat due to various environmental factors. There is a need to create more spatially refined pesticide mitigation areas (e.g., Pesticide Use Limitation Areas, PULAs) to better identify habitats where mitigation may be required. We have implemented a process during recent work with carbamates which has allowed us to explore more detailed habitat definitions to refine areas within a species range that, according to the most recent documentation from FWS, are required for a species’ continued recovery. We have worked to develop a “core map” representing locations of the species where mitigations are needed based on species range, critical habitat, known locations, and suitable habitat. We have focused on using the best publicly available spatial datasets in conjunction with the most recent FWS species documentation to build detailed core maps for a wide variety of endangered species. Experience has shown us that, while challenges with resources and uncertainty exist, this range refinement process is possible and valuable for assessment of risk to many endangered species. This presentation lays out the lessons learned and choices made while developing more refined pesticide mitigation areas, based on our extensive experience with species range, critical habitat, potentially suitable habitat and known locations in support of the carbamate BOs.},
keywords = {2024, Presentation, SETAC North America},
pubstate = {published},
tppubtype = {presentation}
}
2023
Insinga, L. (Applied Analysis Solutions, LLC); Kay, S. (Pyxis Regulatory Consulting, Inc); Desmarteau, D. (Waterborne Environmental, Inc.)
10.10.2023.
Abstract | Links | Tags: 2023, EMPM, Presentation
@misc{EMPM2023pwc,

title = {PWC-PREP Tool: A user-friendly tool to facilitate preparation of label-compliant Pesticide in Water Calculator (PWC) batch input files},

author = {Insinga, L. (Applied Analysis Solutions, LLC) and Kay, S. (Pyxis Regulatory Consulting, Inc) and Desmarteau, D. (Waterborne Environmental, Inc.) },

url = {https://appliedanalysis.solutions/wp-content/uploads/2024/05/EMPM-2023-PWC-Prep-Tool.pdf, View Presentation},

year  = {2023},

date = {2023-10-10},

urldate = {2023-10-10},

abstract = {The USEPA’s Pesticide in Water Calculator (PWC) simulates pesticide applications to land surfaces and subsequent transport to and fate in waterbodies.  When using PWC, one significant issue is accurately modeling pesticides as they typically have diverse uses and restrictions that vary based on the use site, region, and time of year.  These uses and restrictions are codified in the product label and can be highly interrelated with many permutations of potential applications. Therefore, defining conservative yet label-compliant use-patterns can be difficult and time consuming.  Failure to account for all labeled agronomic restrictions including total pesticide amount applied and number of application limitations on an annual and interval specific (e.g., pre-emergence or post-emergence) basis, as well as multiple application rates with rate-specific limitations (i.e., number of applications and temporal windows), minimum reapplication intervals, and pre-harvest intervals can lead to modeling of non-label-compliant or unrealistic application use patterns.  In addition, efforts to ensure modeling is conservative (e.g., simulation of applications during wettest months of the year for ESA assessments, or maximizing total amount applied in a year) can significantly complicate application date assignment logic.  To address these difficulties, the Generic Endangered Species Task Force (GESTF) has developed the PWC-PREP Tool to facilitate batch file preparation for PWC modeling.  Specifically, the PWC-PREP Tool features a robust algorithm that generates label-compliant application dates and rates for a wide variety of use sites, regions, and chemicals.  Leveraging a graphical user interface, the tool is highly configurable and allows the user to control modeling parameters related to application methods, drift factors, agronomic restrictions, and date-assignment. The PWC-PREP Tool to has been successfully used to efficiently parameterize a national set of PWC runs (n > 30,000) that follow label instructions in a manner that is transparent and can be repeated.},

keywords = {2023, EMPM, Presentation},

pubstate = {published},

tppubtype = {presentation}

}
2021

Holmes, C.M. (Applied Analysis Solutions, LLC); Insinga, L. (Applied Analysis Solutions, LLC); Sweeney, P. (Syngenta); Loiseau, L. (Syngenta AG); Johnson, D. (Syngenta)
Comprehensive Characterization of Agricultural Proximity to Surface Water in France Presentation
05.02.2021.
Links | Tags: 2021, Presentation, SETAC Europe
@misc{2021EUFR,

title = {Comprehensive Characterization of Agricultural Proximity to Surface Water in France},

author = {Holmes, C.M. (Applied Analysis Solutions, LLC) and Insinga, L. (Applied Analysis Solutions, LLC) and Sweeney, P. (Syngenta) and Loiseau, L. (Syngenta AG) and Johnson, D. (Syngenta)},

url = {https://appliedanalysis.solutions/wp-content/uploads/2020/12/SETAC-EU-2021-FRmaize-extended-abstract.pdf, Extended abstract

https://appliedanalysis.solutions/wp-content/uploads/2021/06/SETAC-EU-2021-FR-proximity-final.pdf, Presentation slides

https://youtu.be/I2DOn-g2UeY, Presentation video

},

year  = {2021},

date = {2021-05-02},

urldate = {2021-05-02},

organization = {Syngenta, Jeallot’s Hill, Bracknell, UK},

keywords = {2021, Presentation, SETAC Europe},

pubstate = {published},

tppubtype = {presentation}

}
Holmes, C.M. (Applied Analysis Solutions, LLC); Marshall, S. (Consultant, UK); Maltby, L. (The University of Sheffield); Sweeney, P. (Syngenta); Thorbek, P. (BASF); Otte, J.C. (BASF)
05.02.2021.
Links | Tags: 2021, Poster, Presentation, SETAC Europe
@misc{2021EU2study,
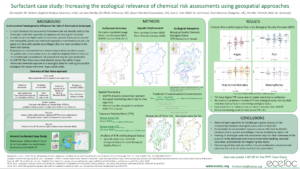
title = {Increasing Ecological Relevance of Chemical Risk Assessments Using Geospatial Approaches: Results From Two Case Studies},
author = {Holmes, C.M. (Applied Analysis Solutions, LLC) and Marshall, S. (Consultant, UK) and Maltby, L. (The University of Sheffield) and Sweeney, P. (Syngenta) and Thorbek, P. (BASF) and Otte, J.C. (BASF)},
url = {https://appliedanalysis.solutions/wp-content/uploads/2020/12/SETAC-EU-2021-ECETOC-extended-abstract.pdf, Extended abstract
https://appliedanalysis.solutions/wp-content/uploads/2021/06/SETAC-EU-2021-ECETOC-platform-final.pdf, Presentation slides
https://appliedanalysis.solutions/wp-content/uploads/2021/06/SETAC-EU-2021-ECETOC-platform-final.pdf, Surfactant case study poster
https://appliedanalysis.solutions/wp-content/uploads/2021/06/SETAC-EU-2021-ECETOC-PPP-case-study-poster-final.pdf, PPP case study poster
https://www.youtube.com/watch?v=ZdxQrdubIs8, Presentation video},
year = {2021},
date = {2021-05-02},
urldate = {2021-05-02},
keywords = {2021, Poster, Presentation, SETAC Europe},
pubstate = {published},
tppubtype = {presentation}
}
Holmes, C.M. (Applied Analysis Solutions, LLC); Pritsolas, J. (Southern Illinois University Edwardsville); Pearson, R. (Southern Illinois University Edwardsville); Butts-Wilmsmeyer, C. (Southern Illinois University Edwardsville); Schad, T. (Bayer CropScience)
Grassland Management Change Over 25 Years: A Landscape Analysis Using Remote Sensing Presentation
05.02.2021.
Links | Tags: 2021, Presentation, SETAC Europe
@misc{2021EUGrass,

title = {Grassland Management Change Over 25 Years: A Landscape Analysis Using Remote Sensing},

author = {Holmes, C.M. (Applied Analysis Solutions, LLC) and Pritsolas, J. (Southern Illinois University Edwardsville) and Pearson, R. (Southern Illinois University Edwardsville) and Butts-Wilmsmeyer, C. (Southern Illinois University Edwardsville) and Schad, T. (Bayer CropScience)},

url = {https://appliedanalysis.solutions/wp-content/uploads/2020/12/SETAC-EU-2021-Grassland-extended-abstract.pdf, Extended abstract

https://www.youtube.com/watch?v=EZ-WS-4W-BY, Presentation video},

year  = {2021},

date = {2021-05-02},

urldate = {2021-05-02},

keywords = {2021, Presentation, SETAC Europe},

pubstate = {published},

tppubtype = {presentation}

}
Holmes, C.E. (Virginia Polytechnic Institute & State University); Löw, F.; Schad, T. (Bayer CropScience); Holmes, C.M. (Applied Analysis Solutions, LLC)
05.02.2021.
Links | Tags: 2021, Presentation, SETAC Europe
@misc{2021EUEarthEE,

title = {Landscape Characterization with Google Earth Engine: Functionality Supporting High Resolution Spatiotemporal Analyses Using Satellite Imagery},

author = {Holmes, C.E. (Virginia Polytechnic Institute & State University) and Löw, F. and Schad, T. (Bayer CropScience) and Holmes, C.M. (Applied Analysis Solutions, LLC)},

url = {https://appliedanalysis.solutions/wp-content/uploads/2021/09/SETAC-EU-2021-Earth-Engine-extended-abstract-final.pdf, Extended abstract

https://www.youtube.com/watch?v=QsUPxFrjZos, Presentation video},

year  = {2021},

date = {2021-05-02},

urldate = {2021-05-02},

keywords = {2021, Presentation, SETAC Europe},

pubstate = {published},

tppubtype = {presentation}

}
Holmes, C.M. (Applied Analysis Solutions, LLC)
Prospective Modelling of Microplastic Exposure in Freshwater Systems Presentation
03.25.2021.
Abstract | Links | Tags: 2021, Presentation, SETAC Virtual Seminars
@misc{2021Micro,
title = {Prospective Modelling of Microplastic Exposure in Freshwater Systems},
author = {Holmes, C.M. (Applied Analysis Solutions, LLC)},
url = {https://appliedanalysis.solutions/wp-content/uploads/2021/06/SETAC-MP-Seminar-4-Holmes-Freshwater-modeling-of-MPs.pdf, View Presentation},
year = {2021},
date = {2021-03-25},
urldate = {2021-03-25},
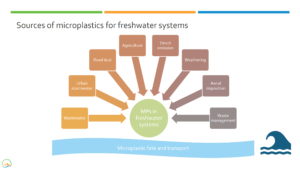
abstract = {Understanding the sources, emissions and environmental fate of plastics is a challenge being examined in parallel with empirical methods of microplastic detection, characterization and quantification. Freshwater systems are increasingly being identified as significant sources of microplastics within the marine environment. Plastics can enter freshwater systems from many sources, such as direct emission (e.g., watsewater treatment plants), via runoff from land surfaces (e.g., urban stormwater, road washoff, agricultural land), air deposition, and direct entry of macroplastics from mismanaged waste/recycling. This presentation will discuss aspects related to the entry, fate and transport of microplastics in riverine environments, and how prospective exposure modelling can help provide information to support subsequent exposure and risk assessment. The scientific body of knowledge related to microplastic exposure, effects and potential risk continues to expand. And as with management of other substances entering the environment, good science should be our guiding principle to inform any decision making process.},
keywords = {2021, Presentation, SETAC Virtual Seminars},
pubstate = {published},
tppubtype = {presentation}
}
2020

Holmes, C.M. (Applied Analysis Solutions, LLC); Pearson, R. (Southern Illinois University Edwardsville); Pritsolas, J. (Southern Illinois University Edwardsville); Butts-Wilmsmeyer, C. (Southern Illinois University Edwardsville); Schad, T. (Bayer CropScience)
Informing Effects Modeling Using Historic Changes in Habitat Derived from Remote Sensing Presentation
11.15.2020.
Abstract | Links | Tags: 2020, Presentation, SETAC North America
@misc{2020NAIE,
title = {Informing Effects Modeling Using Historic Changes in Habitat Derived from Remote Sensing},
author = {Holmes, C.M. (Applied Analysis Solutions, LLC) and Pearson, R. (Southern Illinois University Edwardsville) and Pritsolas, J. (Southern Illinois University Edwardsville) and Butts-Wilmsmeyer, C. (Southern Illinois University Edwardsville) and Schad, T. (Bayer CropScience)},
url = {https://www.youtube.com/watch?v=vvEMOeC50mw, Presentatio video},
year = {2020},
date = {2020-11-15},
urldate = {2020-11-15},
abstract = {Ecological effects modeling for population or community level environmental risk assessment seeks to describe the interactions of biological, chemical, environmental and anthropogenic factors in relation to stressor-response relationships. Changes in landscape over time can play a large role in habitat suitability and species occurrence, important aspects in population-level modeling. Landscape change can be assessed from retrospective analyses or predictive efforts based on models or assumptions.
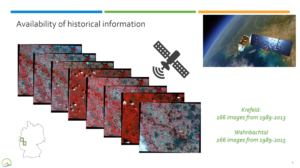
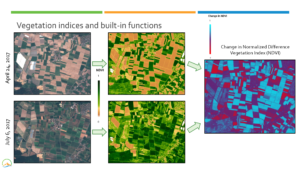
This presentation describes novel remote sensing image processing methods used to capture landscape-level changes in grassland extent and management within a 300 km2 area over a 25-year period near Krefeld, Germany. Over 150 satellite images were acquired from NOAA’s Landsat program spanning 1989 to 2013 from all seasons. Images within each year were normalized for atmospheric and illumination variation to focus on vegetation changes due to plant structure and vigor using different vegetation indices based on visible and infra-red wavelengths.
Four groups of grassland fields were identified using a k-means clustering algorithm based on spectral information. In several groups, periods of distinct increase in vegetation biomass (defined by vegetation indices) could indicate changes in grassland management practices over that time from natural grassland cycles to include more intensive management activities (e.g., fertilization, more frequent cutting, silage production). Other groups showed relative consistency across time.
All data used in this study are geographically referenced and processed in a Geographic Information System (GIS). These data are suitable for spatially-explicit landscape-level ecological modeling efforts exploring the multitude of stressors that may impact biological communities over time. This is especially important for retrospective modeling studies where ecological models are used to explain empirically derived data over time (e.g., sampling of insect counts and biomass). Grassland areas are important habitat for some groups of insects and understanding historic changes in grassland extent and management provides a key factor in the study of landscape-level ecological effects modeling. We have demonstrated the feasibility and applicability of utilizing information from freely available satellite image archives for habitat characterization of historic landscape patterns and changes over a 25-year period.},
keywords = {2020, Presentation, SETAC North America},
pubstate = {published},
tppubtype = {presentation}
}
This presentation describes novel remote sensing image processing methods used to capture landscape-level changes in grassland extent and management within a 300 km2 area over a 25-year period near Krefeld, Germany. Over 150 satellite images were acquired from NOAA’s Landsat program spanning 1989 to 2013 from all seasons. Images within each year were normalized for atmospheric and illumination variation to focus on vegetation changes due to plant structure and vigor using different vegetation indices based on visible and infra-red wavelengths.
Four groups of grassland fields were identified using a k-means clustering algorithm based on spectral information. In several groups, periods of distinct increase in vegetation biomass (defined by vegetation indices) could indicate changes in grassland management practices over that time from natural grassland cycles to include more intensive management activities (e.g., fertilization, more frequent cutting, silage production). Other groups showed relative consistency across time.
All data used in this study are geographically referenced and processed in a Geographic Information System (GIS). These data are suitable for spatially-explicit landscape-level ecological modeling efforts exploring the multitude of stressors that may impact biological communities over time. This is especially important for retrospective modeling studies where ecological models are used to explain empirically derived data over time (e.g., sampling of insect counts and biomass). Grassland areas are important habitat for some groups of insects and understanding historic changes in grassland extent and management provides a key factor in the study of landscape-level ecological effects modeling. We have demonstrated the feasibility and applicability of utilizing information from freely available satellite image archives for habitat characterization of historic landscape patterns and changes over a 25-year period.
Kern, M. (Balance EcoSolutions, LLC); Holmes, C.M. (Applied Analysis Solutions, LLC); Kay, S. (Pyxis Regulatory Consulting, Inc); Cowles, J. (Tessenderlo Kerley, Inc.); Henry, K. (Tessenderlo Kerley, Inc.)
Advancing Beyond the Draft Biological Evaluation of Carbaryl for Federally Listed Species Presentation
11.15.2020.
Abstract | Links | Tags: 2020, Presentation, SETAC North America
@misc{2020NAAB,
title = {Advancing Beyond the Draft Biological Evaluation of Carbaryl for Federally Listed Species},
author = {Kern, M. (Balance EcoSolutions, LLC) and Holmes, C.M. (Applied Analysis Solutions, LLC) and Kay, S. (Pyxis Regulatory Consulting, Inc) and Cowles, J. (Tessenderlo Kerley, Inc.) and Henry, K. (Tessenderlo Kerley, Inc.)},
url = {https://www.youtube.com/watch?v=Pw_V_MXP3f8, Presentation video},
year = {2020},
date = {2020-11-15},
urldate = {2020-11-15},
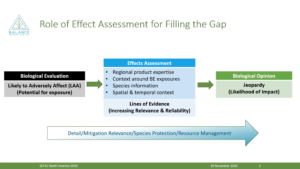
abstract = {The Endangered Species Act (ESA) requires federal agencies to ensure that their actions are not likely to jeopardize the continued existence, nor destroy or adversely modify the designated critical habitat, of species listed as threatened or endangered under the ESA. For pesticides, a Biological Evaluation (BE) is conducted by the EPA as a first step in the ESA assessment. If EPA’s BE determines a pesticide may affect a listed species or its designated critical habitat, EPA must initiate consultation with the U.S. Fish and Wildlife Service and/or the National Marine Fisheries Service (Services) depending on which agency has jurisdiction over the species.
On March 17, 2020, EPA posted to the Federal Register (FRL-10006-38) the release of their draft Biological Evaluation (BE) assessing potential risks to listed species from labeled uses of carbaryl. In parallel, the EPA posted a Revised Method document (EPA-HQ-OPP-2019-0195) detailing updated methods for conducting a BE. The revised methods include the use of actual pesticide usage data and distribution of treated acres, alternate assumptions for species population numbers, probabilistic approaches, and a weight-of-evidence framework for making effect determinations. As noted in the BE, the methods used in these analyses continue to evolve over time.
To further support this advancement, case studies implementing the Revised Methods were conducted to understand and evaluate the approaches used in the draft BE for carbaryl. To increase the reliability and relevance of the assessment, this work also considered additional methods and lines of evidence to reduce uncertainty. Central to this approach is analyzing potential impacts to a species for individual use patterns and including species specific information. The transparency and availability of information from the full BE analysis is critical to support the Services in jeopardy determinations. The case studies demonstrate the need to bring as many relevant and realistic lines of evidence into the assessment as early as possible to help advance the evaluation of risk to listed species and inform the development of the Biological Opinion (BO) for carbaryl.},
keywords = {2020, Presentation, SETAC North America},
pubstate = {published},
tppubtype = {presentation}
}
On March 17, 2020, EPA posted to the Federal Register (FRL-10006-38) the release of their draft Biological Evaluation (BE) assessing potential risks to listed species from labeled uses of carbaryl. In parallel, the EPA posted a Revised Method document (EPA-HQ-OPP-2019-0195) detailing updated methods for conducting a BE. The revised methods include the use of actual pesticide usage data and distribution of treated acres, alternate assumptions for species population numbers, probabilistic approaches, and a weight-of-evidence framework for making effect determinations. As noted in the BE, the methods used in these analyses continue to evolve over time.
To further support this advancement, case studies implementing the Revised Methods were conducted to understand and evaluate the approaches used in the draft BE for carbaryl. To increase the reliability and relevance of the assessment, this work also considered additional methods and lines of evidence to reduce uncertainty. Central to this approach is analyzing potential impacts to a species for individual use patterns and including species specific information. The transparency and availability of information from the full BE analysis is critical to support the Services in jeopardy determinations. The case studies demonstrate the need to bring as many relevant and realistic lines of evidence into the assessment as early as possible to help advance the evaluation of risk to listed species and inform the development of the Biological Opinion (BO) for carbaryl.
Holmes, C.M. (Applied Analysis Solutions, LLC); Tandy, E. (Applied Analysis Solutions, LLC); Schleicher, Z. (Southern Illinois University, Edwardsville); Kilgallon, J. (Unilever Safety & Environmental Assurance Centre); Speirs, L. (Unilever Safety & Environmental Assurance Centre); Hodges, J. (Unilever Safety & Environmental Assurance Centre)
11.15.2020.
Abstract | Links | Tags: 2020, Presentation, SETAC North America
@misc{2020NAMarine,
title = {Marine Emissions From Municipal Treatment Plants: Refining Our Understanding and Defining Spatial Variability at a Global Scale},
author = {Holmes, C.M. (Applied Analysis Solutions, LLC) and Tandy, E. (Applied Analysis Solutions, LLC) and Schleicher, Z. (Southern Illinois University, Edwardsville) and Kilgallon, J. (Unilever Safety & Environmental Assurance Centre) and Speirs, L. (Unilever Safety & Environmental Assurance Centre) and Hodges, J. (Unilever Safety & Environmental Assurance Centre)},
url = {https://www.youtube.com/watch?v=i3L-9_ySzmo, Presentation video},
year = {2020},
date = {2020-11-15},
urldate = {2020-11-15},
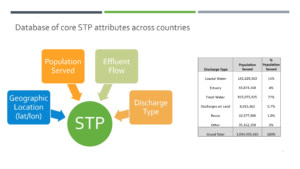
abstract = {Pharmaceuticals, pesticides, biocides, and ingredients in home and personal care products are often disposed of via waste water. This can lead to exposure of aquatic ecosystems through discharge from municipal wastewater treatment plants (WWTPs). Aquatic exposure models primarily focus on freshwater systems and often address marine exposures simply as a variation of a freshwater scenario (e.g., by increasing the dilution factor). However, the average population density in coastal areas is now twice the world’s average population density, and many of the world’s coasts are becoming increasingly urban (14 of the world’s 17 largest cities are coastal located). Thus developing a better understanding of marine emissions is thus becoming increasingly important.
The aim of this research is to develop and analyze a global-scale dataset focusing on marine emissions (i.e., near shore coastal waters) with the goal of understanding what fraction of the population in coastal areas may be discharging directly to marine environments. The ultimate goal is to couple this information with environmental exposure models using spatially-explicit information on substance uses, pathways to the environment, and eventual fate in aquatic ecosystems.
Information on WWTP location, population served, and effluent flow were collected for 44,000 WWTPs across seven case studies (AU, BR, CA, EU, MX, SG, and US) covering all four hemispheres (North/South, East/West) for over one billion people. WWTPs were attributed as discharging to coastal waters (CW) from source data or analysis of receiving waterbody. Spatial analysis showed that WWTPs for 27% of the population served are within 10km of the coast. Global hydrologic data were used to identify 50,000 basins with the potential to discharge to coastal waters. Basins within our seven case studies were analyzed to characterize the WWTPs and population in terms of CW discharge. Of the 258,000 people in these coastal basins served by WWTPs, 50% are served by WWTPs discharging to coastal waters. Spatial population data were used to characterize coastal basins globally, with results extrapolated to other countries, to assess the potential for marine emissions using data on basins, distance to coast, gridded population, and urban delineations.
This is a novel step forward in understanding potential global-scale marine emissions from WWTPs with the goal of balancing realism and practical applicability in environmental safety programs.},
keywords = {2020, Presentation, SETAC North America},
pubstate = {published},
tppubtype = {presentation}
}
The aim of this research is to develop and analyze a global-scale dataset focusing on marine emissions (i.e., near shore coastal waters) with the goal of understanding what fraction of the population in coastal areas may be discharging directly to marine environments. The ultimate goal is to couple this information with environmental exposure models using spatially-explicit information on substance uses, pathways to the environment, and eventual fate in aquatic ecosystems.
Information on WWTP location, population served, and effluent flow were collected for 44,000 WWTPs across seven case studies (AU, BR, CA, EU, MX, SG, and US) covering all four hemispheres (North/South, East/West) for over one billion people. WWTPs were attributed as discharging to coastal waters (CW) from source data or analysis of receiving waterbody. Spatial analysis showed that WWTPs for 27% of the population served are within 10km of the coast. Global hydrologic data were used to identify 50,000 basins with the potential to discharge to coastal waters. Basins within our seven case studies were analyzed to characterize the WWTPs and population in terms of CW discharge. Of the 258,000 people in these coastal basins served by WWTPs, 50% are served by WWTPs discharging to coastal waters. Spatial population data were used to characterize coastal basins globally, with results extrapolated to other countries, to assess the potential for marine emissions using data on basins, distance to coast, gridded population, and urban delineations.
This is a novel step forward in understanding potential global-scale marine emissions from WWTPs with the goal of balancing realism and practical applicability in environmental safety programs.
2019
Holmes, C.M. (Applied Analysis Solutions, LLC); DeLeo, P. (Integral Consulting, Inc); Kransler, K. (SI Group); Carrar, A. (Kao Corporation)
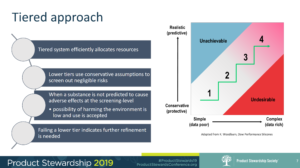
Tiers for Fears: Applying Fit-for-Purpose Risk Assessment in Environmental Stewardship Presentation
09.10.2019.
Abstract | Links | Tags: 2019, Presentation
@misc{2019PSC,

title = { Tiers for Fears: Applying Fit-for-Purpose Risk Assessment in Environmental Stewardship},

author = {Holmes, C.M. (Applied Analysis Solutions, LLC) and DeLeo, P. (Integral Consulting, Inc) and Kransler, K. (SI Group) and Carrar, A. (Kao Corporation)},

url = {https://appliedanalysis.solutions/wp-content/uploads/2020/01/PS2019-Tiers-for-Fears_Session-2-Holmes.pdf, View Presentation},

year  = {2019},

date = {2019-09-10},

urldate = {2019-09-10},

abstract = {Proper environmental stewardship of products necessitates an understanding of materials in use and potential impacts to humans and wildlife from environmental releases. However, there are limits to resources that may be devoted to such efforts. The trick is in knowing How much is enough? A tiered risk assessment methodology uses an iterative approach of increasingly sophisticated investigation for those instances where the substance assessment requires additional information. This session will discuss the tiered assessment paradigm as it applies to environmental hazards and exposures, and present methods and models used to refine our understanding of potential risk. For example, environmental releases can occur during various stages of a product's life-cycle such as manufacture, use and disposal. Screening and higher-tier exposure and fate models used to predict environmental concentrations will be discussed. Likewise, the spectrum of hazard data acquisition will be explored from use of existing data directly or through read-across, computational methods, laboratory investigations and field studies. Case studies will be presented illustrating real-world application of these methods across diverse chemistries and products.},

keywords = {2019, Presentation},

pubstate = {published},

tppubtype = {presentation}

}