2020

Holmes, C.M. (Applied Analysis Solutions, LLC); Pearson, R. (Southern Illinois University Edwardsville); Pritsolas, J. (Southern Illinois University Edwardsville); Butts-Wilmsmeyer, C. (Southern Illinois University Edwardsville); Schad, T. (Bayer CropScience)
Informing Effects Modeling Using Historic Changes in Habitat Derived from Remote Sensing Presentation
11.15.2020.
Abstract | Links | Tags: 2020, Presentation, SETAC North America
@misc{2020NAIE,

title = {Informing Effects Modeling Using Historic Changes in Habitat Derived from Remote Sensing},

author = {Holmes, C.M. (Applied Analysis Solutions, LLC) and Pearson, R. (Southern Illinois University Edwardsville) and Pritsolas, J. (Southern Illinois University Edwardsville) and Butts-Wilmsmeyer, C. (Southern Illinois University Edwardsville) and Schad, T. (Bayer CropScience)},

url = {https://www.youtube.com/watch?v=vvEMOeC50mw, Presentatio video},

year  = {2020},

date = {2020-11-15},

urldate = {2020-11-15},

abstract = {Ecological effects modeling for population or community level environmental risk assessment seeks to describe the interactions of biological, chemical, environmental and anthropogenic factors in relation to stressor-response relationships. Changes in landscape over time can play a large role in habitat suitability and species occurrence, important aspects in population-level modeling. Landscape change can be assessed from retrospective analyses or predictive efforts based on models or assumptions.


This presentation describes novel remote sensing image processing methods used to capture landscape-level changes in grassland extent and management within a 300 km2 area over a 25-year period near Krefeld, Germany. Over 150 satellite images were acquired from NOAA’s Landsat program spanning 1989 to 2013 from all seasons. Images within each year were normalized for atmospheric and illumination variation to focus on vegetation changes due to plant structure and vigor using different vegetation indices based on visible and infra-red wavelengths.


Four groups of grassland fields were identified using a k-means clustering algorithm based on spectral information. In several groups, periods of distinct increase in vegetation biomass (defined by vegetation indices) could indicate changes in grassland management practices over that time from natural grassland cycles to include more intensive management activities (e.g., fertilization, more frequent cutting, silage production). Other groups showed relative consistency across time.


All data used in this study are geographically referenced and processed in a Geographic Information System (GIS). These data are suitable for spatially-explicit landscape-level ecological modeling efforts exploring the multitude of stressors that may impact biological communities over time. This is especially important for retrospective modeling studies where ecological models are used to explain empirically derived data over time (e.g., sampling of insect counts and biomass). Grassland areas are important habitat for some groups of insects and understanding historic changes in grassland extent and management provides a key factor in the study of landscape-level ecological effects modeling. We have demonstrated the feasibility and applicability of utilizing information from freely available satellite image archives for habitat characterization of historic landscape patterns and changes over a 25-year period.},

keywords = {2020, Presentation, SETAC North America},

pubstate = {published},

tppubtype = {presentation}

}
This presentation describes novel remote sensing image processing methods used to capture landscape-level changes in grassland extent and management within a 300 km2 area over a 25-year period near Krefeld, Germany. Over 150 satellite images were acquired from NOAA’s Landsat program spanning 1989 to 2013 from all seasons. Images within each year were normalized for atmospheric and illumination variation to focus on vegetation changes due to plant structure and vigor using different vegetation indices based on visible and infra-red wavelengths.
Four groups of grassland fields were identified using a k-means clustering algorithm based on spectral information. In several groups, periods of distinct increase in vegetation biomass (defined by vegetation indices) could indicate changes in grassland management practices over that time from natural grassland cycles to include more intensive management activities (e.g., fertilization, more frequent cutting, silage production). Other groups showed relative consistency across time.
All data used in this study are geographically referenced and processed in a Geographic Information System (GIS). These data are suitable for spatially-explicit landscape-level ecological modeling efforts exploring the multitude of stressors that may impact biological communities over time. This is especially important for retrospective modeling studies where ecological models are used to explain empirically derived data over time (e.g., sampling of insect counts and biomass). Grassland areas are important habitat for some groups of insects and understanding historic changes in grassland extent and management provides a key factor in the study of landscape-level ecological effects modeling. We have demonstrated the feasibility and applicability of utilizing information from freely available satellite image archives for habitat characterization of historic landscape patterns and changes over a 25-year period.
Kern, M. (Balance EcoSolutions, LLC); Holmes, C.M. (Applied Analysis Solutions, LLC); Kay, S. (Pyxis Regulatory Consulting, Inc); Cowles, J. (Tessenderlo Kerley, Inc.); Henry, K. (Tessenderlo Kerley, Inc.)
Advancing Beyond the Draft Biological Evaluation of Carbaryl for Federally Listed Species Presentation
11.15.2020.
Abstract | Links | Tags: 2020, Presentation, SETAC North America
@misc{2020NAAB,
title = {Advancing Beyond the Draft Biological Evaluation of Carbaryl for Federally Listed Species},
author = {Kern, M. (Balance EcoSolutions, LLC) and Holmes, C.M. (Applied Analysis Solutions, LLC) and Kay, S. (Pyxis Regulatory Consulting, Inc) and Cowles, J. (Tessenderlo Kerley, Inc.) and Henry, K. (Tessenderlo Kerley, Inc.)},
url = {https://www.youtube.com/watch?v=Pw_V_MXP3f8, Presentation video},
year = {2020},
date = {2020-11-15},
urldate = {2020-11-15},
abstract = {The Endangered Species Act (ESA) requires federal agencies to ensure that their actions are not likely to jeopardize the continued existence, nor destroy or adversely modify the designated critical habitat, of species listed as threatened or endangered under the ESA. For pesticides, a Biological Evaluation (BE) is conducted by the EPA as a first step in the ESA assessment. If EPA’s BE determines a pesticide may affect a listed species or its designated critical habitat, EPA must initiate consultation with the U.S. Fish and Wildlife Service and/or the National Marine Fisheries Service (Services) depending on which agency has jurisdiction over the species.
On March 17, 2020, EPA posted to the Federal Register (FRL-10006-38) the release of their draft Biological Evaluation (BE) assessing potential risks to listed species from labeled uses of carbaryl. In parallel, the EPA posted a Revised Method document (EPA-HQ-OPP-2019-0195) detailing updated methods for conducting a BE. The revised methods include the use of actual pesticide usage data and distribution of treated acres, alternate assumptions for species population numbers, probabilistic approaches, and a weight-of-evidence framework for making effect determinations. As noted in the BE, the methods used in these analyses continue to evolve over time.
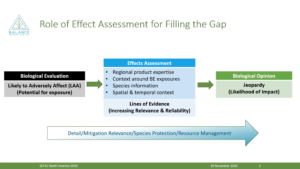
To further support this advancement, case studies implementing the Revised Methods were conducted to understand and evaluate the approaches used in the draft BE for carbaryl. To increase the reliability and relevance of the assessment, this work also considered additional methods and lines of evidence to reduce uncertainty. Central to this approach is analyzing potential impacts to a species for individual use patterns and including species specific information. The transparency and availability of information from the full BE analysis is critical to support the Services in jeopardy determinations. The case studies demonstrate the need to bring as many relevant and realistic lines of evidence into the assessment as early as possible to help advance the evaluation of risk to listed species and inform the development of the Biological Opinion (BO) for carbaryl.},
keywords = {2020, Presentation, SETAC North America},
pubstate = {published},
tppubtype = {presentation}
}
On March 17, 2020, EPA posted to the Federal Register (FRL-10006-38) the release of their draft Biological Evaluation (BE) assessing potential risks to listed species from labeled uses of carbaryl. In parallel, the EPA posted a Revised Method document (EPA-HQ-OPP-2019-0195) detailing updated methods for conducting a BE. The revised methods include the use of actual pesticide usage data and distribution of treated acres, alternate assumptions for species population numbers, probabilistic approaches, and a weight-of-evidence framework for making effect determinations. As noted in the BE, the methods used in these analyses continue to evolve over time.
To further support this advancement, case studies implementing the Revised Methods were conducted to understand and evaluate the approaches used in the draft BE for carbaryl. To increase the reliability and relevance of the assessment, this work also considered additional methods and lines of evidence to reduce uncertainty. Central to this approach is analyzing potential impacts to a species for individual use patterns and including species specific information. The transparency and availability of information from the full BE analysis is critical to support the Services in jeopardy determinations. The case studies demonstrate the need to bring as many relevant and realistic lines of evidence into the assessment as early as possible to help advance the evaluation of risk to listed species and inform the development of the Biological Opinion (BO) for carbaryl.
Holmes, C.M. (Applied Analysis Solutions, LLC); Tandy, E. (Applied Analysis Solutions, LLC); Schleicher, Z. (Southern Illinois University, Edwardsville); Kilgallon, J. (Unilever Safety & Environmental Assurance Centre); Speirs, L. (Unilever Safety & Environmental Assurance Centre); Hodges, J. (Unilever Safety & Environmental Assurance Centre)
11.15.2020.
Abstract | Links | Tags: 2020, Presentation, SETAC North America
@misc{2020NAMarine,
title = {Marine Emissions From Municipal Treatment Plants: Refining Our Understanding and Defining Spatial Variability at a Global Scale},
author = {Holmes, C.M. (Applied Analysis Solutions, LLC) and Tandy, E. (Applied Analysis Solutions, LLC) and Schleicher, Z. (Southern Illinois University, Edwardsville) and Kilgallon, J. (Unilever Safety & Environmental Assurance Centre) and Speirs, L. (Unilever Safety & Environmental Assurance Centre) and Hodges, J. (Unilever Safety & Environmental Assurance Centre)},
url = {https://www.youtube.com/watch?v=i3L-9_ySzmo, Presentation video},
year = {2020},
date = {2020-11-15},
urldate = {2020-11-15},
abstract = {Pharmaceuticals, pesticides, biocides, and ingredients in home and personal care products are often disposed of via waste water. This can lead to exposure of aquatic ecosystems through discharge from municipal wastewater treatment plants (WWTPs). Aquatic exposure models primarily focus on freshwater systems and often address marine exposures simply as a variation of a freshwater scenario (e.g., by increasing the dilution factor). However, the average population density in coastal areas is now twice the world’s average population density, and many of the world’s coasts are becoming increasingly urban (14 of the world’s 17 largest cities are coastal located). Thus developing a better understanding of marine emissions is thus becoming increasingly important.
The aim of this research is to develop and analyze a global-scale dataset focusing on marine emissions (i.e., near shore coastal waters) with the goal of understanding what fraction of the population in coastal areas may be discharging directly to marine environments. The ultimate goal is to couple this information with environmental exposure models using spatially-explicit information on substance uses, pathways to the environment, and eventual fate in aquatic ecosystems.
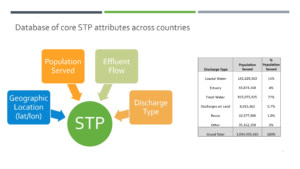
Information on WWTP location, population served, and effluent flow were collected for 44,000 WWTPs across seven case studies (AU, BR, CA, EU, MX, SG, and US) covering all four hemispheres (North/South, East/West) for over one billion people. WWTPs were attributed as discharging to coastal waters (CW) from source data or analysis of receiving waterbody. Spatial analysis showed that WWTPs for 27% of the population served are within 10km of the coast. Global hydrologic data were used to identify 50,000 basins with the potential to discharge to coastal waters. Basins within our seven case studies were analyzed to characterize the WWTPs and population in terms of CW discharge. Of the 258,000 people in these coastal basins served by WWTPs, 50% are served by WWTPs discharging to coastal waters. Spatial population data were used to characterize coastal basins globally, with results extrapolated to other countries, to assess the potential for marine emissions using data on basins, distance to coast, gridded population, and urban delineations.
This is a novel step forward in understanding potential global-scale marine emissions from WWTPs with the goal of balancing realism and practical applicability in environmental safety programs.},
keywords = {2020, Presentation, SETAC North America},
pubstate = {published},
tppubtype = {presentation}
}
The aim of this research is to develop and analyze a global-scale dataset focusing on marine emissions (i.e., near shore coastal waters) with the goal of understanding what fraction of the population in coastal areas may be discharging directly to marine environments. The ultimate goal is to couple this information with environmental exposure models using spatially-explicit information on substance uses, pathways to the environment, and eventual fate in aquatic ecosystems.
Information on WWTP location, population served, and effluent flow were collected for 44,000 WWTPs across seven case studies (AU, BR, CA, EU, MX, SG, and US) covering all four hemispheres (North/South, East/West) for over one billion people. WWTPs were attributed as discharging to coastal waters (CW) from source data or analysis of receiving waterbody. Spatial analysis showed that WWTPs for 27% of the population served are within 10km of the coast. Global hydrologic data were used to identify 50,000 basins with the potential to discharge to coastal waters. Basins within our seven case studies were analyzed to characterize the WWTPs and population in terms of CW discharge. Of the 258,000 people in these coastal basins served by WWTPs, 50% are served by WWTPs discharging to coastal waters. Spatial population data were used to characterize coastal basins globally, with results extrapolated to other countries, to assess the potential for marine emissions using data on basins, distance to coast, gridded population, and urban delineations.
This is a novel step forward in understanding potential global-scale marine emissions from WWTPs with the goal of balancing realism and practical applicability in environmental safety programs.